
Reports & Analytics
The Reports module gives you data-driven insights into your accelerator's performance.
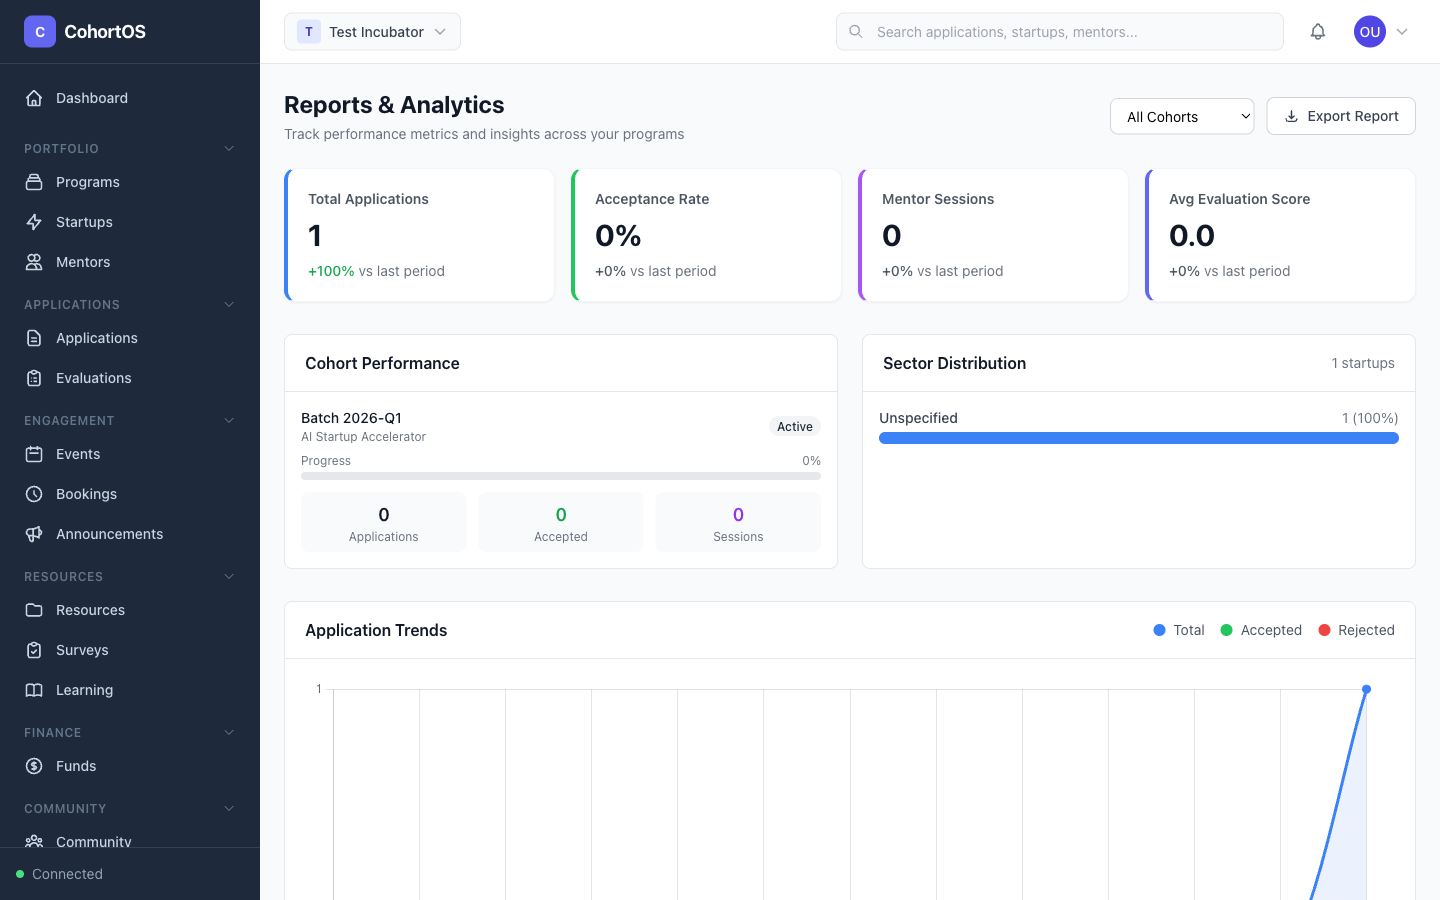
Reports Dashboard
Navigate to Operations → Reports to access analytics.

Available Reports
- Program overview — Active programs, cohort progress, completion rates
- Application funnel — Submissions, conversion rates by stage
- Startup metrics — Portfolio composition by stage, industry, funding
- Mentor engagement — Sessions completed, hours logged, feedback scores
- Event attendance — Registration vs. actual attendance, event popularity
Dashboard Metrics
Your main dashboard already shows key metrics at a glance:
- Total programs and active cohorts
- Portfolio size and startup stages
- Pending applications
- Upcoming events
- Applications by status (pie chart)
- Startups by stage (bar chart)
- Events over time (line chart)
- Programs by status (donut chart)